The HackSysExtremeVulnerableDriver by HackSysTeam always interested me and I got positive feedback on writing about it, so here we are.
Repo with all code can be found here.
This N-part tutorial will walk you through the kernel exploit development cycle. It’s important to notice that we will be dealing with known vulnerabilities, no reversing is needed (for the driver at least).
By the end of tutorial, you should be familiar with common vulnerability classes and how they’re exploited, able to port exploits from x86 to x64 arch (if possible) and be familiar with newer mitigations in Windows 10.
What’s kernel debugging?
Unlike user-mode debugging where you can pause execution of a single process, kernel-mode debugging breaks on the entire system, meaning you won’t be able to use it at all. A debugger machine is needed so you can communicate with the debuggee, observe memory or kernel data structures, or catch a crash.
Reading material:
What’s kernel exploitation?
Something more fun than user-mode exploitation ;)
The main goal is to gain execution with kernel-mode context. A successful exploit could result in elevated permissions and what you can do is only bound by your imagination (anywhere from cool homebrew to APT-sponsored malware).
Goal for this tutorial is getting a shell with SYSTEM permissions.
How will this tutorial be organized?
- Part 1: Setting up the environment
- Configure the 3 VMs + debuggee machine.
- Configure WinDBG.
- Part 2: Payloads
- Placeholder for common payloads to be used later, this will allow us to focus on vulnerability-specific details in future posts and refer to this post when needed.
- Part 3-N:
- One or more post per vulnerability.
Kernel exploit development lifecycle
- Finding a vulnerability: This won’t be covered in this tutorial as we already know exactly where the vulnerabilities are.
- Hijacking execution flow: Some vulnerabilities allow code execution, others require more than that.
- Privilege escalation: Main goal will be to get a shell with SYSTEM privileges.
- Restore execution flow: Uncaught exceptions in kernel-mode result in a system crash. Unless a DoS exploit makes you sleep at night we need to address this.
What are the targets?
Exploitation will be attempted on the following targets (no specific version is needed yet):
- a Win7 x86 VM
- a Win7 x64 VM
- a Win10 x64 VM
Normally we’ll start with the x86 machine, followed by porting it to the Win7 x64 one. Some exploits won’t run on the Win10 machine due to some newer mitigations that are added. We’ll either have to tweak the exploit or come up with an entirely different approach.
What software do I need?
- Hyper-visor software, lots of options.
- Windows 7 x86 VM
- Windows 7 x64 VM
- Windows 10 x64 VM
- VirtualKD
- OSR Driver Loader
Setting up the debuggee machines
The debuggee is our guinea pig. We’ll use it to load the vulnerable driver and communicate with it. This machine will crash a lot as most exceptions in kernel will result in BSOD. Make sure you give it enough RAM.
Per debuggee:
-
Inside the VirtualKD folder, run
target\vminstall.exe. This will add a boot entry that has debugging enabled and connects automatically to the VirtualKD server on the debugger machine.
For the Windows 10 VM, you need to enable test signing. This allows you to load unsigned drivers into the kernel.
Runningbcdedit /set testsinging onand rebooting will show “Test Mode” on the desktop.NOTE: Windows 10 supports communicating through the network and in my experience is usually faster. To do that, follow this.
-
Run the OSR Driver Loader, register the service then start it. You may need to reboot.
-
Optional: Install VM guest additions.
-
Set up a low-priv account, this should be used while exploiting.
 C:\Windows\system32>net user low low /add
 The command completed successfully.
Setting up the debugger machine
This machine will be the one debugging the debuggee machine through WinDBG. You’ll be able to inspect memory and data structures and manipulate them if needed. Having a remote debugging session running when the debuggee crashes allows us to break into the VM and/or analyze a crash.
VirtualKD host will automatically communicate with a named pipe instead of setting it up manually. If you’re network debugging the Win10 VM, you’ll need to test the connection manually.
-
Install the Windows SDK (link). You can select the “Debugging Tools for Windows” only.
-
Verify that WinDBG is installed, Win10 SDK is by default installed in
C:\Program Files (x86)\Windows Kits\10\Debuggers.
Add it to the system path and set up the debugger path in VirtualKD.
Reboot one of the debuggee machines while the VirtualKD host is running on the debugger. You should be able to start a WinDBG session.
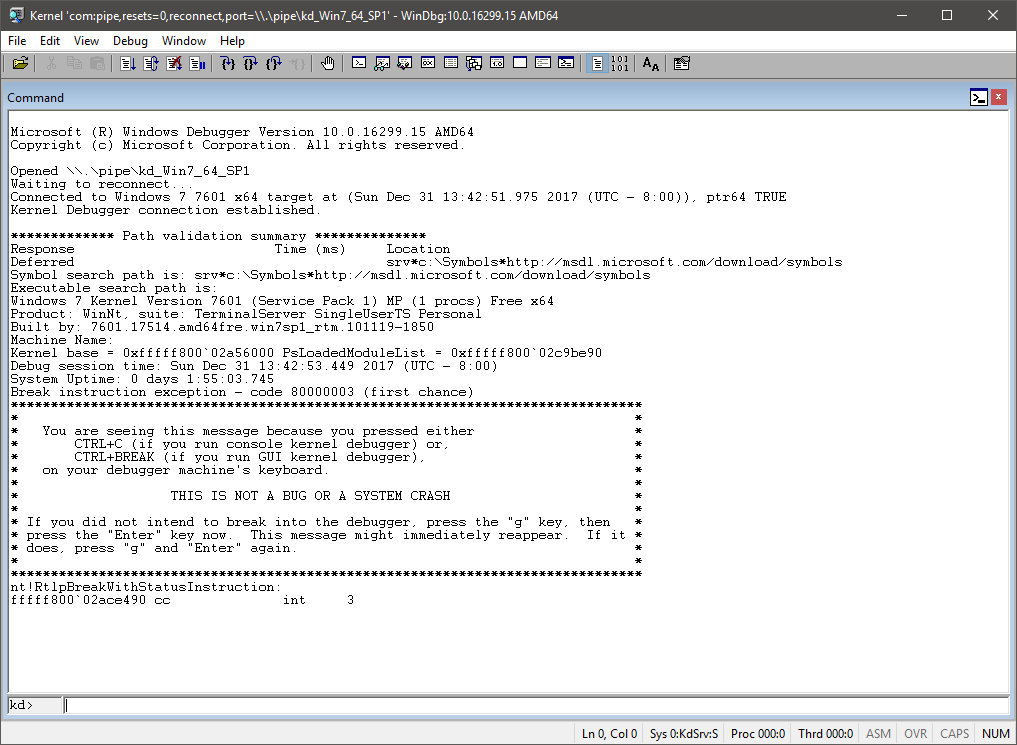
Setting up WinDBG
If everything is set up correctly, WinDBG will pause execution and print some info about the debuggee.
Symbols contain debugging information for lots of Windows binaries. We can get them by executing the following:
.sympath srv*c:\Symbols*http://msdl.microsoft.com/download/symbols;C:\HEVD
.reload /f *.*
Enable verbose debugging:
ed nt!Kd_Default_Mask 0xf
You should be able to find the HEVD module loaded:
kd> lm m HEVD
Browse full module list
start             end                 module name
fffff80b`92b50000 fffff80b`92b59000   HEVD       (deferred)
Save the workspace profile and any environment changes you made by selecting
File -> Save Workspace to File
This is a handy reference to commands used throughout the series.
Type g or hit F5 to continue execution.
HEVD Driver crash course
DriverEntryis the entry point of any driver.
NTSTATUS DriverEntry(IN PDRIVER_OBJECT DriverObject, IN PUNICODE_STRING RegistryPath) {
    UINT32 i = 0;
    PDEVICE_OBJECT DeviceObject = NULL;
    NTSTATUS Status = STATUS_UNSUCCESSFUL;
    UNICODE_STRING DeviceName, DosDeviceName = {0};

    UNREFERENCED_PARAMETER(RegistryPath);
    PAGED_CODE();

    RtlInitUnicodeString(&DeviceName, L"\\Device\\HackSysExtremeVulnerableDriver");
    RtlInitUnicodeString(&DosDeviceName, L"\\DosDevices\\HackSysExtremeVulnerableDriver");

    // Create the device
    Status = IoCreateDevice(DriverObject,
                            0,
                            &DeviceName,
                            FILE_DEVICE_UNKNOWN,
                            FILE_DEVICE_SECURE_OPEN,
                            FALSE,
                            &DeviceObject);

    ...
}
-
This routine contains an
IoCreateDevicecall that contains the driver name we’ll be using to communicate with it. -
DriverObjectwill get populated with necesarry structures and function pointers. -
What matters to us for HEVD is the function pointer assigned to
DriverObject->MajorFunction[IRP_MJ_DEVICE_CONTROL]which is routine responsible for handling IOCTLs. -
In HEVD, this function is called
IrpDeviceIoCtlHandlerand it’s basically a large switch case for every IOCTL. Ever vulnerability has a unique IOCTL.
Example: HACKSYS_EVD_IOCTL_STACK_OVERFLOW is the IOCTL used to trigger the stack overflow vulnerability.
That’s it! Next post will discuss payloads. For now, it’ll only include a generic token-stealing payload that’ll be used for part 3.
I’m aware this post doesn’t cover lots of issues you can run into. Due to the scope of this tutorial, you’ll need to figure out a lot on your own, but you’re welcome to comment with your questions if needed.
-Abatchy